
The MACD indicator, short for Moving Average Convergence Divergence, is one of the most powerful tools used in crypto technical analysis. It helps traders identify trends, momentum, and potential buy or sell signals in the market.
Unlike simple indicators, MACD provides a combination of trend-following and momentum analysis, making it extremely useful for both beginners and experienced traders. In highly volatile markets like cryptocurrency, having a reliable indicator like MACD can improve decision making and trading accuracy.
Platforms like TradingView and CoinMarketCap allow traders to easily apply MACD on charts and analyze real time market trends.
Table of Contents
What is MACD Indicator
MACD is a trend and momentum indicator that shows the relationship between two moving averages of a cryptocurrency’s price. It consists of three main components. The MACD line, which is the difference between two moving averages. The signal line, which is a moving average of the MACD line. The histogram, which shows the difference between the MACD line and the signal line. These components work together to provide clear signals about market trends and momentum.
How MACD indicator Works
MACD works by comparing short term and long term price movements.
When the short term moving average moves above the long term average, it indicates bullish momentum. When the short term moving average moves below the long term average, it indicates bearish momentum.
The MACD line reflects this difference, while the signal line helps confirm trends. The histogram visually shows the strength of the trend by expanding or contracting. Platforms like TradingView automatically calculate and display MACD, making it easy to use.
MACD Buy and Sell Signals
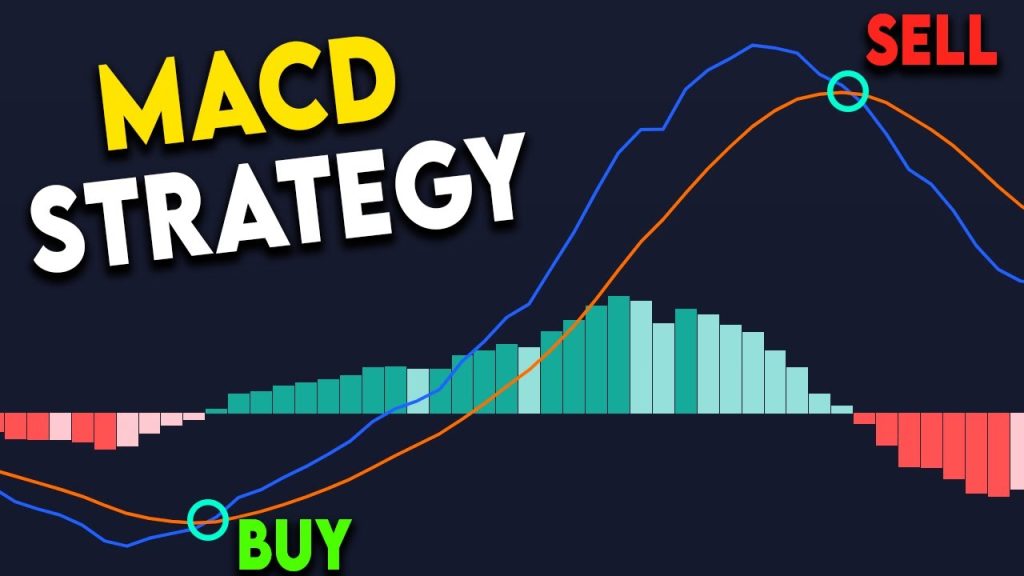
One of the main uses of MACD indicator is identifying buy and sell signals.
A bullish signal occurs when the MACD line crosses above the signal line. This indicates that buying momentum is increasing and may present a buying opportunity.
A bearish signal occurs when the MACD line crosses below the signal line. This suggests that selling pressure is increasing and may signal a selling opportunity.
These crossovers are widely used by traders to enter and exit trades.
MACD Histogram Explained
The histogram is an important part of MACD that shows the difference between the MACD line and the signal line.
When the histogram is above zero, it indicates bullish momentum. When it is below zero, it indicates bearish momentum.
A growing histogram shows increasing strength of a trend, while a shrinking histogram may signal a potential reversal. Understanding the histogram helps traders identify trend strength and possible changes in momentum.
MACD Divergence
MACD divergence is a powerful strategy used to predict trend reversals.
Bullish divergence occurs when the price makes a lower low, but MACD makes a higher low. This suggests that selling pressure is weakening and a price increase may occur.
Bearish divergence occurs when the price makes a higher high, but MACD makes a lower high. This indicates weakening buying pressure and a possible price drop.
Divergence provides early signals of potential trend changes.
Best MACD Settings
- The default MACD settings are 12, 26, and 9.
- These numbers represent the periods used to calculate the moving averages and signal line.
- Most traders use default settings because they work well in different market conditions.
- However, some traders adjust settings for faster or slower signals depending on their trading strategy.
- Short term traders may use smaller values, while long term traders may prefer smoother settings.
How to Use MACD Effectively
To get the best results from MACD, it should be used with other tools.
- Combining MACD with support and resistance levels improves accuracy.
- Using MACD with RSI helps confirm overbought or oversold conditions.
- Trendlines and volume analysis can also strengthen MACD signals.
- For example, a bullish crossover near a strong support level increases the chances of a successful trade.
- Platforms like CoinGecko provide market insights that can support MACD based strategies.
Common Mistakes to Avoid
- Many traders make mistakes when using MACD.
- Relying only on MACD without confirmation can lead to false signals.
- Ignoring market trends can reduce accuracy.
- Entering trades too early without waiting for confirmation is risky.
- Using MACD in sideways markets can produce misleading signals.
- Avoiding these mistakes improves trading performance.
Benefits of MACD Indicator
- MACD offers several advantages for traders.
- It provides clear buy and sell signals.
- It combines trend and momentum analysis.
- It works well in trending markets.
- It is easy to use and widely available on trading platforms.
- Because of these benefits, MACD is one of the most popular indicators in crypto trading.
Conclusion
The MACD indicator is a powerful tool for analyzing crypto markets and identifying trading opportunities. By understanding how MACD works, including crossovers, histogram, and divergence, traders can make more informed decisions.
However, like all indicators, MACD should not be used alone. Combining it with other technical analysis tools and practicing regularly is essential for success.
With experience and proper strategy, MACD can become a key part of your crypto trading system and help you navigate the volatile crypto market more effectively.

1 thought on “MACD Indicator Strategy for Trading – Powerful Guide 2026”