
Moving averages are among the most powerful and widely used tools in crypto technical analysis. They help traders identify trends, filter market noise, and make better trading decisions. Among all moving averages, the 50 EMA and 200 EMA are considered the most important for understanding market direction.
These two indicators are used by both beginners and professional traders to identify long term and short term trends. When used correctly, they can provide clear signals for buying, selling, and trend confirmation.
Platforms like TradingView and CoinMarketCap allow traders to apply moving averages easily and analyze crypto charts in real time.
Table of Contents
What are Moving Averages
A moving average is an indicator that calculates the average price of a cryptocurrency over a specific period. It smooths out price fluctuations and helps traders see the overall trend.
There are two main types of moving averages.
Simple Moving Average calculates the average price over a set period. Exponential Moving Average gives more weight to recent prices, making it more responsive to market changes. The 50 EMA and 200 EMA are both exponential moving averages and are widely used in crypto trading.
What is 50 EMA
The 50 EMA represents the average price of a cryptocurrency over the last 50 periods. It reacts relatively quickly to price changes and is used to identify short to medium term trends.
When the price is above the 50 EMA, it usually indicates a bullish trend. When the price is below the 50 EMA, it suggests a bearish trend. Traders often use the 50 EMA to find entry points during trending markets.
What is 200 EMA
The 200 EMA represents the average price over a longer period and is used to identify the overall market trend.
It is considered a strong indicator of long term trend direction. If the price is above the 200 EMA, the market is generally considered bullish. If the price is below the 200 EMA, the market is considered bearish. The 200 EMA acts as a strong support or resistance level in many cases.
Golden Cross and Death Cross
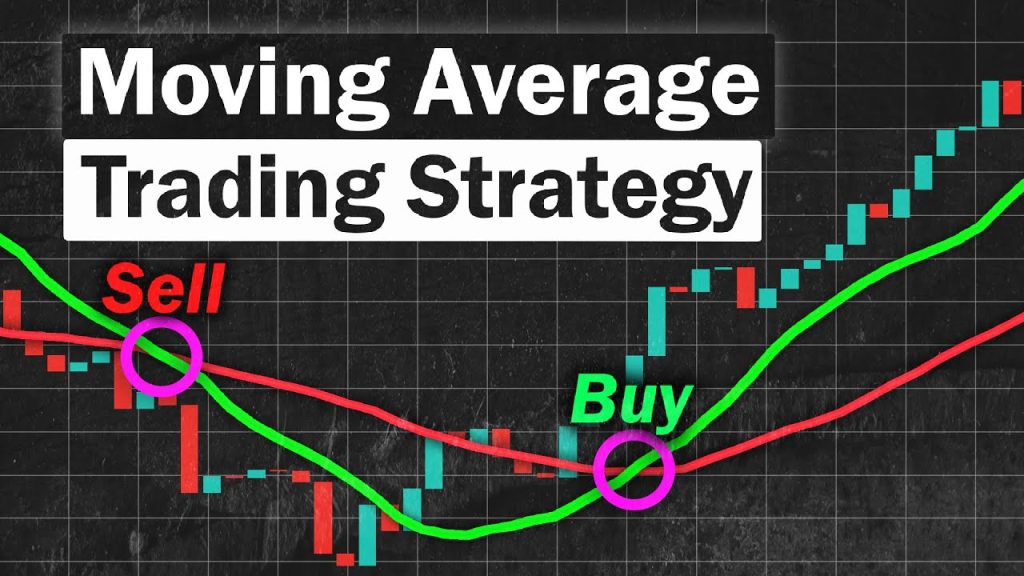
One of the most important strategies using 50 EMA and 200 EMA is the crossover strategy.
A Golden Cross occurs when the 50 EMA crosses above the 200 EMA. This signals a potential long term bullish trend and is often seen as a buying opportunity.
A Death Cross occurs when the 50 EMA crosses below the 200 EMA. This indicates a potential bearish trend and may signal a selling opportunity. These signals are widely used by traders and investors.
How to Use 50 EMA and 200 EMA Together
- Using both EMAs together provides a clearer picture of the market.
- When the price is above both 50 EMA and 200 EMA, it indicates a strong uptrend.
- When the price is below both, it indicates a strong downtrend.
- When the price is between the two, the market may be in a consolidation phase.
- Traders use these signals to decide whether to enter, exit, or wait.
EMA as Support and Resistance
- Moving averages often act as dynamic support and resistance levels.
- In an uptrend, the price may bounce from the 50 EMA or 200 EMA, acting as support.
- In a downtrend, the price may face rejection at these levels, acting as resistance.
- This makes EMAs useful for identifying entry and exit points.
- Platforms like TradingView allow traders to visualize these levels clearly.
Best Time Frames for EMA Strategy
- The effectiveness of EMA depends on the time frame used.
- Short time frames like 15 minutes or 1 hour are used for day trading.
- Medium time frames like 4 hours are used for swing trading.
- Long time frames like daily charts are best for long term trends.
- The 50 EMA and 200 EMA work best on higher time frames for more reliable signals.
Combining EMA with Other Indicators
- To improve accuracy, traders combine EMA with other indicators.
- Using EMA with RSI helps confirm overbought or oversold conditions.
- Combining EMA with MACD provides better trend confirmation.
- Support and resistance levels can further strengthen trading decisions.
- Platforms like CoinGecko provide additional market data to support analysis.
Common Mistakes to Avoid
- Many beginners make mistakes when using EMA strategies.
- Relying only on crossovers without confirmation can lead to false signals.
- Ignoring the overall trend can result in losses.
- Using EMAs on very low time frames can produce unreliable signals.
- Entering trades too late after a crossover can reduce profit potential.
- Avoiding these mistakes improves trading results.
Benefits of Using EMA Strategy
- EMA strategies offer several advantages.
- They help identify trends clearly.
- They provide dynamic support and resistance levels.
- They are easy to use and widely available.
- They work well in trending markets.
- Because of these benefits, EMAs are used by traders worldwide.
Conclusion
The 50 EMA and 200 EMA strategy is one of the most effective methods for analyzing crypto markets. By understanding how these moving averages work and how to use crossovers like Golden Cross and Death Cross, traders can identify strong trends and make better decisions.
However, like all indicators, EMAs should be used with other tools for confirmation. With practice and proper strategy, moving averages can become a powerful part of your crypto trading system and help you navigate the market more confidently.
Also Check MACD Indicator Strategy for Trading – Powerful Guide 2026

1 thought on “Moving Averages Strategy – Powerful Guide – 2026”